
Pulse Amplitude Modulation (PAM) is a one dimensional or in other words real modulation. Simply put it is an extension of BPSK with M amplitude levels instead of two. This can be a bit confusing because BPSK can be looked at as a phase modulation and its natural extension must be QPSK or 8-PSK modulations. To remove this ambiguity lets call M-PAM an extension of simple amplitude modulation but with M levels. In the discussion below we consider M=4 but then extend it to the general case of M=2k (k=1,2,3…).
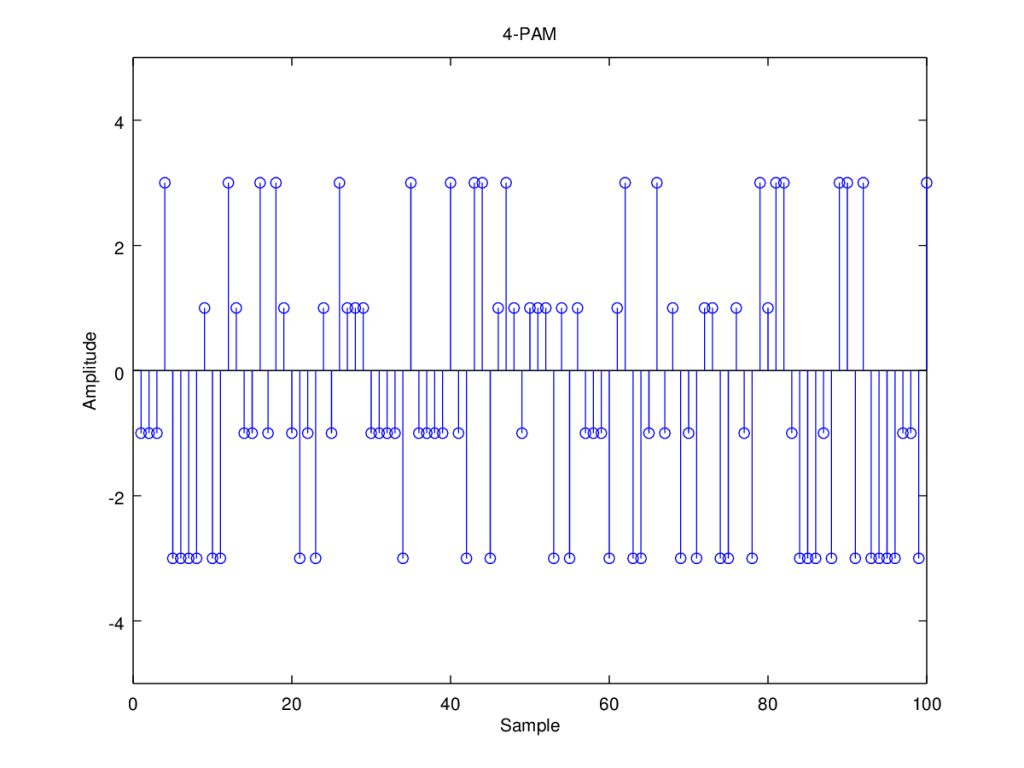
The symbol generation and detection of 4-PAM is slightly more complicated than BPSK/BASK/OOK as four amplitude levels are involved. A “for loop” with four conditions are used for both symbol generation and detection. The four symbols are +/-1 and +/-3 and the average energy per symbol is calculated as (1+1+9+9)/4=5. Remember that the energy per symbol is simply the average of squared Euclidean distances of the symbols from the origin.
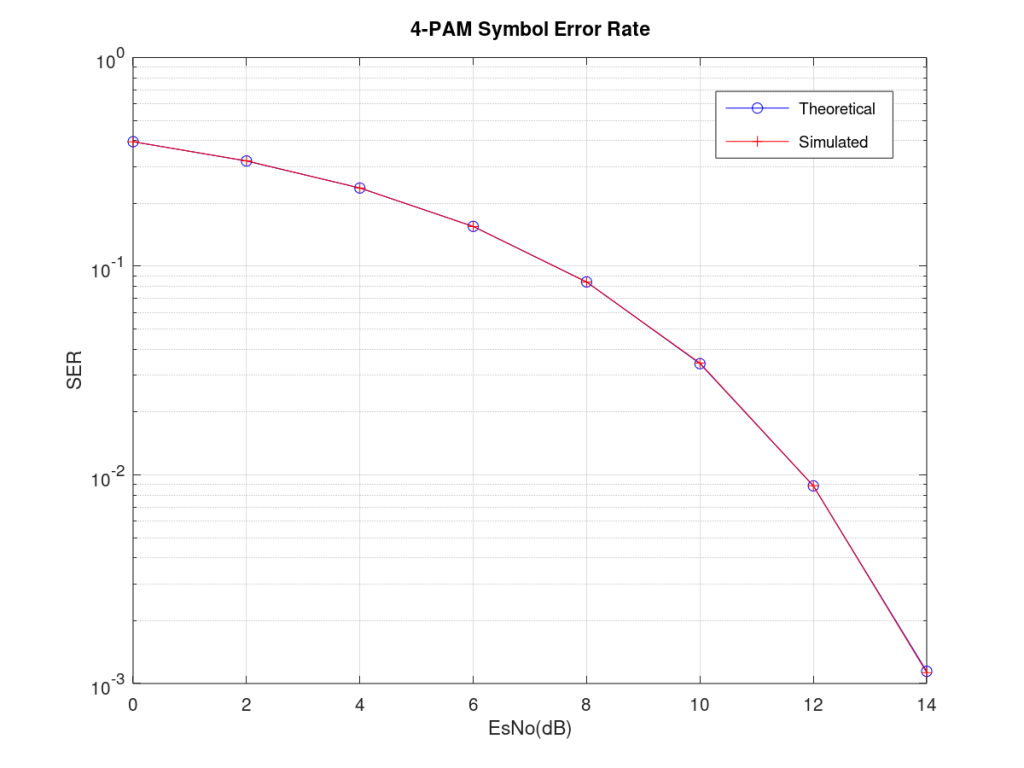
As is customary Additive White Gaussian Noise (AWGN) with standard deviation of sigma is added to the signal. This can be used to vary the Energy Per Symbol to Noise Power Spectral Density Ratio (EsNo). Theoretical and simulated Symbol Error Rate (SER) curves are generated by varying the EsNo from 0dB to 14dB. Remember that if an imaginary component is added to 4-PAM also with four levels we get 16-QAM which is a complex modulation with four bits per symbol (k=4).
%%%%%%%%%%%%%%%%%%%%%%%%%%%%%%%%%%
%   PULSE AMPLITUDE MODULATION   %
%        www.raymaps.com         %
%%%%%%%%%%%%%%%%%%%%%%%%%%%%%%%%%%
clear all
close all

l=1e6;
Es=5;
EsNo_dB=10;
EsNo=10^(EsNo_dB/10);

% Symbol Generation for 4-PAM
s=rand(1,l);
for n=1:length(s)
  if s(n)<0.25
    s(n)=-3;
  elseif s(n)<0.50
    s(n)=-1;
  elseif s(n)<0.75
    s(n)=+1;
  else
    s(n)=+3;
  end
end

% Additive White Gaussian Noise
sigma=sqrt(Es/(2*EsNo));
r=s+sigma*randn(1,l);

% Symbol Detection for 4-PAM
for n=1:length(r)
  if r(n)<-2
    s_est(n)=-3;
  elseif r(n)<0
    s_est(n)=-1;
  elseif r(n)<2
    s_est(n)=+1;
  else
    s_est(n)=+3;
  end
end

% SER Calculation
simulatedSER=(l-sum(s==s_est))/l
theoreticalSER=0.75*erfc(sqrt(0.2*(EsNo)))
Note: Please note that following decision boundaries are used in 4-PAM.
-2 between -3 and -1
0 between -1 and +1
+2 between +1 and +3
Optimized and Generalized Code for M-PAM SER
In the above code for calculation of Symbol Error Rate (SER) for 4-PAM we have used a “for loop” as it is conceptually the simplest. But it is well known that the execution time of a “for loop” is quite high. It is desirable to replace the “for loop” with matrix manipulations. This is shown in the code below. In addition to simplification of code we have also converted it into a generalized form where any M-PAM (M=2,4,8,16…) can be simulated. It must also be noted that complex modulation schemes such as 64-QAM can also be implemented in a similar manner (symbols would have the form a+jb where a and b would be generated independently as shown below). Also calculated is the theoretical SER for M-PAM which matches well with the simulation.
%%%%%%%%%%%%%%%%%%%%%%%%%%%%%%%%%%
%   PULSE AMPLITUDE MODULATION   %
%             M-PAM              %
%        www.raymaps.com         %
%%%%%%%%%%%%%%%%%%%%%%%%%%%%%%%%%%
clear all
close all

M=8;
levels=(1:M)*2-(M+1);
Es=sum((abs(levels)).^2)/length(levels);
EsNo_dB=20;
EsNo=10^(EsNo_dB/10);
l=1e6;

% Symbol Generation
s=2*floor(M*rand(1,l))-(M-1);

% Additive White Gaussian Noise
sigma=sqrt(Es/(2*EsNo));
r=s+sigma*randn(1,l);

% Symbol Detection
[A,B]=min([abs(levels'-r)]);
s_est=B*2-(M+1);

% SER Calculation
simulatedSER=(l-sum(s==s_est))/l
Ef=erfc(sqrt(EsNo/Es));
theoreticalSER=(2/M)*(1/2)*Ef+((M-2)/M)*(1)*Ef
Note: Note that in theoretical SER calculation for M-PAM the probability of symbol error at the two edges is half of the probability of symbol error at the (M-2) central positions. This is because the boundary symbols have only one neighbor whereas the central ones have two. But we can use Ef=erfc(sqrt(EsNo/Es)) as a first estimate for symbol error probability and this becomes successively more accurate as the constellation size (M) increases.