Modulation is the process by which a binary stream (zeros and ones) is converted to a format that is suitable for transmission over a wired or wireless channel that is prone to noise and interference as well as distortion. The most basic modulation scheme is BPSK or Binary Phase Shift Keying. It transmits the information in the phase of the signal which could be one of two values (0 degrees or 180 degrees).
BPSK signal can be represented as (called the passband representation)
s(t)=a(t)*cos(2*pi*f*t)
where a(t) is a time varying parameter which can have one of two values (+1 or -1). This is equivalent to having the phase of the carrier rotated by 0 degrees or 180 degrees. In simulation of digital communications systems we usually take out the carrier and perform the simulation at baseband. The passband and baseband simulations are equivalent because the carrier signal introduced at the transmitter can be easily removed at the receiver by a process called correlation (or simply put multiplication by the carrier followed by low pass filtering) and what we are left with is the parameter a(t).
If the transmitted signal is given as
a(t)*cos(2*pi*f*t)
then by multiplication with the carrier at the receiver we get
a(t)*cos(2*pi*f*t)*cos(2*pi*f*t)
=(a(t)/2)*(1+cos(4*pi*f*t))
and after low pass filtering the cosine term at twice the carrier frequency is removed and we get the parameter a(t) scaled by the factor 1/2. Since the information is contained in the sign of the parameter a(t) we can recover our transmitted symbols.
So in simulation, instead of multiplying the parameter a(t) by the carrier at transmitter and then again at the receiver we simply transmit a(t). This is equivalent to simulation of a Pulse Amplitude Modulation (PAM) system with two levels. Following are the steps involved in the simulation of BPSK system.
Steps:
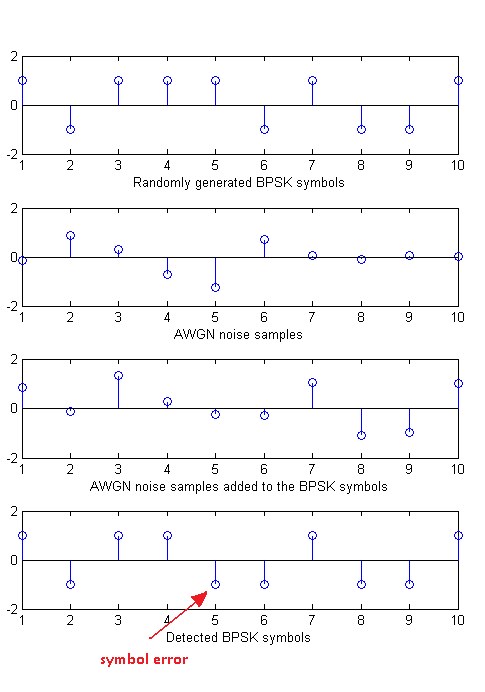
1. Generate a random sequence of symbols (+1,-1)
2. Generate samples of Additive White Gaussian Noise (AWGN) with the required variance (noise power = noise variance OR noise power = square of noise standard deviation OR noise power = noise power spectral density * signal bandwidth).
3. Add AWGN samples to the BPSK signal.
4. Detection is performed at the receiver by determining the sign of the parameter a(t).
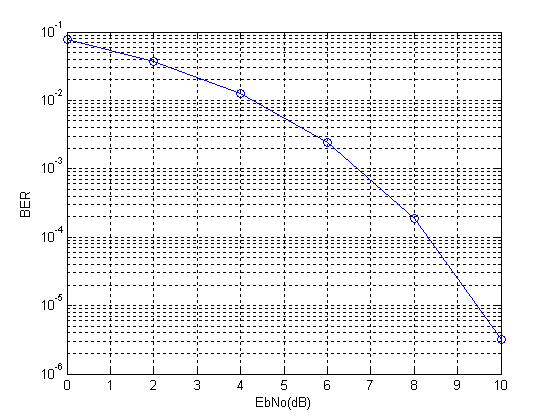
5. And finally the bit error rate (BER) is calculated. Which is the same as symbol error rate (SER) in this case.
Given below is the MATLAB code that performs these functions. Also shown below are the signals generated at the first four steps and the bit error rate calculated in the fifth and last step.
%%%%%%%%%%%%%%%%%%%%%%%%%%%%%%%%%%%%%%%%%%%%%%%%%%%%%%%%%%%%%%%%%%%%%
% FUNCTION TO CALCULATE BER OF BPSK IN AWGN
% l - Input, length of the symbol sequence
% EbNo - Input, energy per bit to noise power spectral density in dB
% ber - Output, bit error rate
%%%%%%%%%%%%%%%%%%%%%%%%%%%%%%%%%%%%%%%%%%%%%%%%%%%%%%%%%%%%%%%%%%%%%
function[ber]=err_rate(l,EbNo)
s=2*(round(rand(1,l))-0.5);             % Generate BPSK symbols
n=(1/sqrt(2*10^(EbNo/10)))*randn(1,l);  % Generate AWGN noise
r=s+n;                                  % Add noise to signal
s_=sign(r);                             % Detect symbols
ber=(l-sum(s==s_))/l;                   % Calculate BER
return
%%%%%%%%%%%%%%%%%%%%%%%%%%%%%%%%%%%%%%%%%%%%%%%%%%%%%%%%%%%%%%%%%%%%%
The length of the symbol sequence and EbNo (a bit different than SNR) are the inputs to the function and the bit error rate (BER) is the output. The length of the sequence must be such that you can count about 25 symbol errors at each value of EbNo. This means that at an EbNo of 10dB you would need to pass a few million symbols through the channel. Try it out!!!
Note:
1. To generate the above given bit error rate plot you would have to create a piece of code which calls the above function for each value of EbNo and stores the output BER value in an array and then plot the BER vs EbNo at the end of simulation. We leave this to you as an exercise.
2. We have generated BPSK symbols directly instead of first generating a binary sequence. This does not matter much in this simple example but for more advanced modulation schemes we would have to first generate a binary stream and then from that the symbols.
3. We have used one sample per symbol of BPSK modulation, as shown in the figure above. But sometimes we have to select higher number of samples per symbol (usually 4 to 10) to implement some other signal processing functions.
4. Most of the concepts discussed above can be extended to other digital modulation schemes. The concepts for analog modulation schemes are somewhat different and we do not use error rates to evaluate the performance of these schemes.
Author: Yasir
More than 20 years of experience in various organizations in Pakistan, the USA, and Europe. Worked with the Mobile and Portable Radio Group (MPRG) of Virginia Tech and Qualcomm USA and was one of the first researchers to propose Space Time Block Codes for eight transmit antennas. Have publsihed a book “Recipes for Communication and Signal Processing” through Springer Nature.
8 thoughts on “Bit Error Rate of BPSK”
Can you please provide the BER for BPSK when oversampling is used, as you did for MSK modulation.
I have some doubts related to normalization, it is not working here as we discussed for MSK.
(like normalizing the signal with 1/sqrt(Ns) OR setting Eb=Ns).
Thank you so much.
i can’t run your matlab code error in this function
function[ber]=err_rate(l,EbNo)
Hi Yogi,
First save the code given above as err_rate.m (a MATLAB executable file). Then give some values to l and EbNo. Such as as l=1e6 and EbNo=10dB. Then run the function file as err_rate(l,EbNo) from the command line. You can also give the input values directly as err_rate(1e6,10) when calling the function from command line. Hope this was helpful. Please let me know.
YA
Thanks. This was helpful and most optimized. Can you help me with 4-FSK matlab code.
Thanks
Umair
Based on the concepts you have learned 4-FSK simulation should be easy to implement.